 ��ת����csdn�ϸ��ָ�����svg���ӣ�����״ͼ�������ٽ��ˣ�ͯ������ ��ת����csdn�ϸ��ָ�����svg���ӣ�����״ͼ�������ٽ��ˣ�ͯ������
����XSLT����SVG��ʽ������ͳ��ͼ ���ܻ�
2002-3-18 13:23:33 --------------------------------------------------------------------------------
������ʸ��ͼ��SVG������һ����ͼ�����������ʸ����������XML�淶������ʽ���������ֿ�����������Դ��������ԣ����������������������������֧�֡�����SVGͼ����ȫ����XML������ˣ����ǾͿ�������XSLT������SVGͼ�����棬���Ǿ�ij��˾һ���е����в�Ʒ�������۶��������������XSLT������SVG��ʽ������ͳ��ͼ������ͳ��ͼ����ʽ�dz��࣬����״ͼ����ͼ������ͼ����ά����Ч��ͼ�ȵȣ��������ォ���ܴ�״����ͼ���ѻ�����ͼ�ͱ�ͼ������ƪ�����ޣ�������ν����ܴ�״����ͼ�����ǻ����Ժ������н���������������ͳ��ͼ�����ɷ�����
Ŀǰ��û��һ���������ȫ֧��SVGͼ�����ʾ��Ϊ���ܹ�������������Ч���������밲װSVG Viewer 3.0��������ص�ַ��http://www.adobe.com/svg/viewer/install/main.html����Windows XPƽ̨�ϣ��Դ���Microsoft Internet Explorer 6����������Adobe SVG Viewer 2.0�IJ���������ĵ�֧�ֲ��ã�������ֱ�����û���������ֵ�SVGͼ�ѱ����е����Ļ���Ӣ�ģ�Ҳ������������еĴ��롣���ǵ�������֧��UTF-16��ƽ̨�Ͽ��Ժܺõ���ʾ�����Ǿ�������Ϊ����
���ȣ�����������Ҫ�����ݣ���ʽ��XML�ġ�����Ŀǰ����������ݿⶼ�ṩ�˶�XML��ѯ�����֧�֣���ˣ�������ֱ���������ݿ�������XML�����ļ���Ҳ���Ծ�����ѯ�����ñ�д����ķ�����������Ҫ��XML�����ļ������ǵ�XML�����ļ�Data.xml��ʽ���£�
<?xml version="1.0" encoding="UTF-8"?>
<sales_summary>
<Month_sales Month_no="1">
<product_sales product_id="PC_INTEL_001" quantity="5" value="5000.00"/>
<product_sales product_id="PC_INTEL_002" quantity="10" value="1500.00"/>
</Month_sales>
<Month_sales Month_no="2">
<product_sales product_id="PC_INTEL_001" quantity="4" value="4000.00"/>
<product_sales product_id="PC_INTEL_002" quantity="10" value="3000.00"/>
<product_sales product_id="PC_AMD_001" quantity="20" value="1500.00"/>
<product_sales product_id="PC_AMD_002" quantity="20" value="1800.00"/>
<product_sales product_id="PC_DIGITAL_001" quantity="11" value="50.00"/>
<product_sales product_id="PC_DIGITAL_002" quantity="18" value="600.00"/>
</Month_sales>
<!-- ����ƪ�����ޣ���������ʡ����3�·ݵ�11�·ݵ����ݣ�������ʱ�������������ϣ���ʽͬǰ -->
<Month_sales Month_no="12">
<product_sales product_id="PC_INTEL_001" quantity="56" value="200.00"/>
<product_sales product_id="PC_INTEL_002" quantity="10" value="500.00"/>
<product_sales product_id="PC_AMD_001" quantity="61" value="1500.00"/>
<product_sales product_id="PC_AMD_002" quantity="8" value="2100.00"/>
<product_sales product_id="PC_DIGITAL_001" quantity="2" value="500.00"/>
<product_sales product_id="PC_DIGITAL_002" quantity="6" value="1200.00"/>
</Month_sales>
</sales_summary>
���棬���ǿ�����ؼ���XSLT���֣������������õ���XSLT���������MsXML2�ļ����������µ�MsXML3.0 SP2��MsXML4.0�����Ե�������վ���أ�http://www.microsoft.com/xml/������ÿһ����ζ�������ע��˵����XSLTToGraph.xsl��
<?xml version="1.0" encoding="UTF-8"?>
<xsl:stylesheet version="1.0"
xmlns:xsl="http://www.w3.org/1999/XSL/Transform">
<!-- ����XSLTת����������ļ��ĸ�ʽ���������ΪXML��ʽ���ļ����� -->
<xsl:output method="xml" indent="yes" encoding="UTF-8" version="1.0" standalone="no" media-type="image/svg+xml"/>
<!-- ���¶���ȫ�ֱ��� -->
<!-- ��״ͼÿ�����Ŀ��� -->
<xsl:variable name="bar_width" select="number(80)"/>
<!-- ÿ����֮��ļ�� -->
<xsl:variable name="bar_spacing" select="number(10)"/>
<!-- ͼ��߶� -->
<xsl:variable name="graph_height" select="number(500)"/>
<!-- ͼ�����߽� -->
<xsl:variable name="left_margin" select="number(100)"/>
<xsl:template match="/">
<!-- SVG�����岿�ֿ�ʼ -->
<svg id="body" viewBox="0 0 -100 {$graph_height + 100}">
<!-- ����Ĵ���ʵ������OnMouseOver��OnMouseOut�¼�ִ�еĴ��룬��ʾ�����ص��µ����۶� -->
<script type="text/ECMAScript"><![CDATA[
function On_MouseOver(evt,HideShow_ID){
// �õ�Ŀ�����
var target = evt.getTarget();
var doc = target.getOwnerDocument();
var HideShow = doc.getElementById(HideShow_ID);
HideShow.setAttribute('style', 'visibility:visible');
}
function On_MouseOut(evt,HideShow_ID){
var target = evt.getTarget();
var doc = target.getOwnerDocument();
var HideShow = doc.getElementById(HideShow_ID);
HideShow.setAttribute('style', 'visibility:hidden');
}
]]></script>
<title>�����ۼ�¼</title>
<!-- ��״ͼ�����岿�� -->
<g id="barChart" transform="translate(10, 10)" fill-rule="nonzero" clip-rule="nonzero" stroke="none" class="legend"
stroke-width="1" stroke-linecap="square" stroke-miterlimit="1" style="text-anchor:start" shape-rendering="crispEdges">
<!-- Ӧ������ģ�� -->
<xsl:apply-templates select="sales_summary"/>
<text text-anchor="middle" transform="matrix(2 0 0 2 {$left_margin + 150} {$graph_height + 70})">ij��˾ÿ�²�Ʒ���ۼ�¼</text>
</g>
</svg>
</xsl:template>
<!-- ����ģ�忪ʼ -->
<xsl:template match="sales_summary">
<!-- �������� -->
<xsl:variable name="weeks_count" select="count(Month_sales)"/>
<!-- �������������۶� -->
<xsl:variable name="max_week_sales_value">
<xsl:for-each select="Month_sales">
<xsl:sort select="sum(product_sales/@value)" data-type="number" order="descending"/>
<xsl:if test="position() = 1">
<xsl:value-of select="sum(product_sales/@value)"/>
</xsl:if>
</xsl:for-each>
</xsl:variable>
<!-- ��״ͼ��Ը߶ȣ�Բ��Ϊ100 -->
<xsl:variable name="max_graph_height" select="floor(($max_week_sales_value + 99) div 100) * 100"/>
<!-- ����ģ�壬������״ͼ�ı�����ͼ�����ֺͱ߿��� -->
<xsl:call-template name="draw_graph">
<xsl:with-param name="max_graph_height" select="$max_graph_height"/>
<xsl:with-param name="bar_count" select="$weeks_count"/>
</xsl:call-template>
<!-- ����ģ�壬������״ͼ��ͼ������ -->
<xsl:apply-templates select="Month_sales">
<xsl:sort select="@Month_no" data-type="number"/>
<xsl:with-param name="max_graph_height" select="$max_graph_height"/>
</xsl:apply-templates>
</xsl:template>
<xsl:template name="draw_graph">
<xsl:param name="max_graph_height"/>
<xsl:param name="bar_count"/>
<xsl:variable name="actual_width" select="($bar_count * ($bar_width + $bar_spacing)) + $bar_spacing"/>
<g id="GridAndLegend" style="stroke:#00FF00;" shape-rendering="crispEdges" stroke-width="1">
<!-- ����������ɫ�ͱ߿��� -->
<path fill="rgb(255, 235, 205)" stroke="#000099" d="M {$left_margin},{$graph_height + 20} h{$actual_width} v-{$graph_height + 10} h-{$actual_width} v{$graph_height +10}"/>
<!-- ����ԭ���ˮƽ�� -->
<path fill="none" stroke="#FF0000" d="M {$left_margin - 10},{$graph_height + 20} h10"/>
<text text-anchor="end" baseline-shift="-3" transform="matrix(1 0 0 1 {$left_margin - 15} {$graph_height + 20})">0</text>
<!-- ������ֱ�ߺ�ͼ������ -->
<xsl:call-template name="draw_graph_vertical_legends">
<xsl:with-param name="max" select="$max_graph_height"/>
<xsl:with-param name="legend_threshold" select="$max_graph_height div $graph_height"/>
<xsl:with-param name="actual_width" select="$actual_width"/>
</xsl:call-template>
</g>
</xsl:template>
<!-- �ݹ���õ�ģ�壬������ֱ�ߺ�ͼ��˵�� -->
<xsl:template name="draw_graph_vertical_legends">
<xsl:param name="max"/>
<xsl:param name="legend_threshold"/>
<xsl:param name="actual_width"/>
<!-- ��ʼ���ֺͲ��� -->
<xsl:param name="start" select="number(100)"/>
<xsl:param name="step" select="number(100)"/>
<xsl:param name="prev_marked_start" select="number(0)"/>
<!-- ���㴹ֱλ�� -->
<xsl:variable name="prev_vert_posn" select="($prev_marked_start div $max) * $graph_height"/>
<xsl:variable name="vert_posn" select="($start div $max) * $graph_height"/>
<!-- ���㱾ˮƽ�ߺ���һ��ˮƽ�ߵļ�� -->
<xsl:variable name="new_marked_start">
<xsl:choose>
<xsl:when test="($vert_posn - $prev_vert_posn) >= $legend_threshold">
<xsl:value-of select="$start"/>
</xsl:when>
<xsl:otherwise>
<xsl:value-of select="$prev_marked_start"/>
</xsl:otherwise>
</xsl:choose>
</xsl:variable>
<!-- ������С��һ����λ��ˮƽ�ߺ�ͼ��˵������ -->
<xsl:if test="$new_marked_start = $start">
<path fill="none" stroke="#FF0000" d="M {$left_margin - 10},{$graph_height + 20 - floor($vert_posn)} h{$actual_width + 10}"/>
<text text-anchor="end" baseline-shift="-3" transform="matrix(1 0 0 1 {$left_margin - 15} {$graph_height + 20 - floor($vert_posn)})">
<xsl:value-of select="$start"/>
</text>
</xsl:if>
<!-- ���û�е������ֵ���ݹ���ñ�ģ�� -->
<xsl:if test="$start < $max">
<xsl:call-template name="draw_graph_vertical_legends">
<xsl:with-param name="max" select="$max"/>
<xsl:with-param name="legend_threshold" select="$legend_threshold"/>
<xsl:with-param name="actual_width" select="$actual_width"/>
<xsl:with-param name="start" select="$start + $step"/>
<xsl:with-param name="step" select="$step"/>
<xsl:with-param name="prev_marked_start" select="$new_marked_start"/>
</xsl:call-template>
</xsl:if>
</xsl:template>
<!-- ����ÿ�µ����ۼ�¼ͼ -->
<xsl:template match="Month_sales">
<xsl:param name="max_graph_height"/>
<!-- ����ÿ�µ����۶���״ͼ���������������ֱ���������������ܶ���ĸ߶ȡ������������λ�� -->
<xsl:variable name="sales_value" select="sum(product_sales/@value)"/>
<xsl:variable name="bar_height" select="floor(($sales_value div $max_graph_height) * $graph_height)"/>
<xsl:variable name="bar_left" select="((position() - 1) * ($bar_width + $bar_spacing)) + $bar_spacing"/>
<!-- ��������������������¼�ִ�еĺ��� -->
<path fill="#0066FF" stroke="none" d="M {$bar_left + $left_margin},{$graph_height + 19} h{$bar_width} v-{$bar_height} h-{$bar_width} v{$bar_height}"
onmouseover="On_MouseOver(evt,'HideShow_{@Month_no}')" onmouseout="On_MouseOut(evt,'HideShow_{@Month_no}')"/>
<!-- ����ͼʾ˵�� -->
<text text-anchor="middle" transform="matrix(1.5 0 0 1.5 {$left_margin + $bar_left + ($bar_width div 2)} {$graph_height + 40})">
<xsl:value-of select="@Month_no"/>
<xsl:text>��</xsl:text>
</text>
<!-- ��������Ƴ�ʱ��ͼ��,����ֱ�ߺ����� -->
<g id="HideShow_{@Month_no}" style="visibility: hidden;">
<!-- ����ˮƽ�� -->
<path fill="none" stroke="red" d="M {$left_margin - 10},{$graph_height + 20 - $bar_height} h{$bar_left + 10}"/>
<!-- д�����֣����۶�������и�ʽ�� -->
<text transform="matrix(1 0 0 1 {$left_margin + $bar_left + 2} {($graph_height + 30) - $bar_height})">
<xsl:value-of select="format-number($sales_value,'#,##0')"/>
</text>
</g>
</xsl:template>
</xsl:stylesheet>
���Ҫ��ҳ���п���SVG��ʽ��ͳ��ͼ�������ְ취��һ��ֱ���ڿͻ���ת������Data.xmlʹ��XSL��ʽ�����ɣ���������ASP�ڷ��������Ƚ���ת������������ͻ��ˡ������������ASP����ɣ���Ϊ������ж���ͳ��ͼ��ʽ�Ļ��������������û�����ѡ����ʾ�����ò�ͬ��XSL�ļ����ɡ�DataToSVG.asp�ļ����£�
<%@ Language="VBScript"%>
<Meta Name="Author" Content="���ܻ�">
<Meta Name="WebSite" Content="http://lucky.myrice.com">
<Meta Name="WebSite" Content="http://www.ccw.com.cn">
<Meta Name="CopyRight" Content="�����ܻ�֮�������硿,����������硷��">
<%
Response.Clear
Response.Buffer = True
Dim xmlDom, xslDom, strResult
Set xmlDom = Server.CreateObject("Msxml2.DOMDocument")
Set xslDom = Server.CreateObject("Msxml2.FreeThreadedDOMDocument")
xmlDom.async = False
xslDom.async = False
xmlDom.load Server.MapPath("Data.xml")
xslDom.load Server.MapPath("XSLTToGraph.xsl")
Response.ContentType = "image/svg+xml"
strResult = xmlDom.transformNode(xslDom)
' �ڲ�֧��UTF-16����Ķ�ƽ̨�ϣ��滻��UTF-8
strResult = Replace(strResult,"UTF-16","UTF-8")
Response.Write strResult
%>
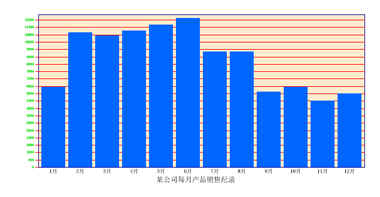
�������ͼ��
 ���������ͼƬ���£� ���������ͼƬ���£�
|

 [����] ����XML��̳ - רҵ��XML���������� ��
XML.ORG.CN������ - ��XMLӦ�� �� �� SVG/GML/VRML/X3D/XAML �� �� ��ת����csdn�ϸ��ָ�����svg���ӣ�����״ͼ�������ٽ��ˣ�ͯ������
[����] ����XML��̳ - רҵ��XML���������� ��
XML.ORG.CN������ - ��XMLӦ�� �� �� SVG/GML/VRML/X3D/XAML �� �� ��ת����csdn�ϸ��ָ�����svg���ӣ�����״ͼ�������ٽ��ˣ�ͯ������


 (���ı���)


 ������


